BuckSort® is designed to sort, organize, and tag your trail camera photos and deliver advanced hunting insights. Download the app today and enjoy a FREE TRIAL.

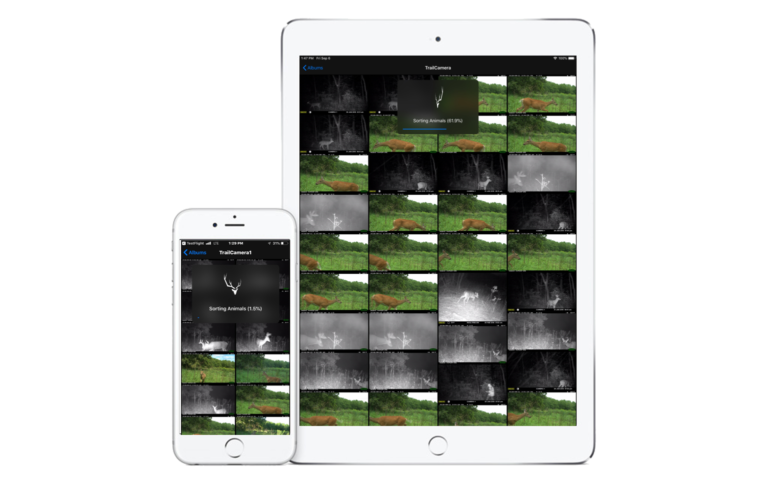
Trail Camera photo sorting and organizing has never been easier. Simply import your trail camera photos and sort them automatically with the click of a button. Utilizing artificial intelligence technologies, BuckSort® sorts your trail camera photos based on the animal identified in the photo. Download the app today!
BuckSort® uses industry-leading artificial intelligence to classify your trail camera photos quickly.
BuckSort® uniquely provides on-device photo classification and sorting, meaning users do NOT need WIFI or cellular connectivity to sort their photos.
BuckSort® classifies photos based on the animals within the photos and sorts them into organized folders.
BuckSort® logs your trail camera photos based on a variety of variables including photo location and time as well as an array of different weather metrics.
The all new BuckSort® App includes Heat Maps, Home Range Maps, and a powerful hourly weather forecasting tool.
The BuckSort® Heat Map shows average animal movement based on selected filters, including: Time Span, Camera Name, Species, Buck Age, and Buck Name.
The BuckSort® Home Range Map shows probable buck roaming areas broken down by Home Range, Core Range, and Hot Zone. These zones can even be adjusted for the Rut.
The BuckSort® weather display is powered by an advanced weather visualization tool and displays hourly forecast visualizations for a wide array of weather metrics.
The BuckSort® App is available on iOS and will soon be available on Android in early Fall 2020. To learn more about the devices that currently support the BuckSort® app, check out the download links below which will take you to either the App Store or Google Playstore.
The BuckSort® app is trail camera agnostic, meaning it can automatically sort photos from any trail camera, regardless of brand. This is possible because we work directly with the photos imported from the SD card.

To import trail camera photos, BuckSort® users can utilize compatible SD Card Readers for their Android or iOS Smartphones or Tablets.

BuckSort® was designed to be a tool for any hunter running trail cameras, regardless of brand or features. Whether you have been browsing Trail Cameras on Amazon, comparing models at Walmart, or looking at cameras at your local sporting goods store, BuckSort® will work for you.
Download the BuckSort® app for free on the Apple App Store or the Google Playstore* (*Fall 2020) and enjoy built-in Artificial Intelligence providing automated photo sorting and organizing. If you find this feature useful, consider one of our In-App Subscriptions.
The BuckSort® App is easy to use. Simply import your trail camera photos from your SD card to your smartphone or tablet and begin sorting and organizing your photos. From there, users can view advanced hunting insights and analytics in the form of Heat Maps, Home Range Maps, Weather Forecasting, and Analytics Charts. To learn more on how to use all the features within BuckSort®, take a look at our comprehensive Tutorial Video—>
The BuckSort® app is a useful tool for anyone using a trail camera. It saves time and delivers advanced hunting insights. Below are just a few of the benefits of the app.
BuckSort® sorts trail camera photos into dedicated sub-folders based on the animal-type identified in each photo. This is accomplished using AI technologies. While the AI isn’t perfect, it is a good first-pass from which users can quickly manually-correct any misidentifications.
BuckSort® was designed to visualize animal movement. Included in the app are a variety of interactive displays, including Heat Maps, Home Range Maps, Weather Forecasting, and Hunting Insight charts.
The BuckSort® app is very user-friendly. Simply add your cameras to the app by tapping “Add Camera”. Next import your trail camera photos directly under your selected camera within the App and tap “Sort Photos”. From there, users can browse the Maps and Analytics tabs within the app to gain useful hunting insights.
All photo sorting within BuckSort® can be accomplished WITHOUT WIFI or cellular connectivity. This allows you to sort your photos in the most remote environments – all you need is a powered device. (*Note: the Maps and Analytics tabs within the app do require connectivity).
The BuckSort® app currently sorts all photos into four categories, Buck, Doe, Other Animal, and Empty. The Other Animal category is a catch-all category that includes animals that have been classified as Bear, Turkey, People, etc.
Setting up trail cameras always involves trade-offs between coverage, quality, and expense. For those on a strict budget, the question often becomes do I set up a bunch of low-cost cameras for maximum coverage or a few high-cost cameras to ensure quality? Regardless of your decision, once you’ve made the investment, it’s important to maximize your investment in your camera set-up. Getting a photo of a trophy buck is great, but there is additional value hidden in that photo. Using the BuckSort® app, users can unlock this hidden data with advanced hunting insights and begin to answer questions like: when does this buck typically walk by my stand, are there any weather factors that change his behavior, what influence has the rut had on his movement, and what areas of my property does he frequent throughout the day?
BuckSort® is a mobile application designed to save you time when sorting and organizing your trail camera photos. Using artificial intelligence, BuckSort® analyzes all of your imported trail camera photos and categorizes them based on the animal in the picture. From there, advanced hunting insights are provided through data visualizations including heat maps, home range maps, weather forecasting tools, and analytics charts.
To use the BuckSort® App, please check out our comprehensive How To Video above or follow the process below:
Camera Creation, Photo Importing, Photo Sorting, Photo Viewing, Buck Aging, Buck Naming, Reclassifying, and Camera Editing & Deleting
1.) Turn on your iOS Device.
2.) Open BuckSort®.
3.) Tap the “Add Camera” button on the top right of the screen. A form will appear asking you to set up your camera. Complete the Form by entering the appropriate information.
Near the end of the form you will notice two questions asking about the camera’s location and heading. To enter the location of the camera, you have three options. The easiest option is to tap the “Find Location” button. This will find the location of your mobile device or tablet and enter it as the location of the camera. However, this method will only work if you have connectivity and it will only be accurate if you are actually standing where you are placing your camera.
An alternative method is to survey in the camera using the satellite map. To do this, simply tap the “Select on Map” button to be taken to the map. Once inside the map, press and hold on the location on the map where you’d like to place your camera – then tap “Save Location.” If this method also does not work, tap the field next to the Location question and simply enter the coordinates of your camera in decimal degrees.
In addition to location, the form will also ask for the camera heading. To lock in the camera heading, you have two options. The easiest option is to tap on the “Get Compass Heading” button. Tapping the button will launch a compass and allow you to point your device in the same direction your camera is pointing and then tap Save.
Depending on your device, the live compass read-out may require connectivity. If this is the case, and you do not have connectivity near your camera, either set the heading when you do have connectivity or simply tap in the Heading field and manually type in the heading of the camera from 0°-360°.
After completing the form, click “Create Camera” and you will see the camera within the Cameras page. The camera will be identified by its name, the property it has been assigned to, and its physical location.
4.) Once you have added a camera, you can now add photos to the camera. To get the most accurate hunting insights, be sure to only add photos to the camera that are specifically associated with that camera.
To import photos, tap on the “Import Photos” button on the top of the screen. When importing photos, you have two data sources you can pull from, either the photo library or an SD card. If you are utilizing an SD Card reader with your device, you can import directly into BuckSort®. Alternatively, you can also import your photos into your photo library and later import your photos into BuckSort® via the Photo Library.
When importing photos, select the photos you would like to Import and then click “Done.” The photos will immediately begin importing into the app. A convenient progress bar will display import status.
Once the photos have been imported, they can now be viewed within the BuckSort® app. Users can scroll through their photos, tap on specific images to view in full screen, or sort the photos.
5.) To sort photos within BuckSort®, users have two options. By tapping on the Sort button on the top of the screen, users can either “Sort by Creation Date” – which sorts the photos from newest to oldest based on Taken Date – or, “Classify” the photos – which uses AI to automatically sort photos into sub-folders based on the animals captured within the photos.
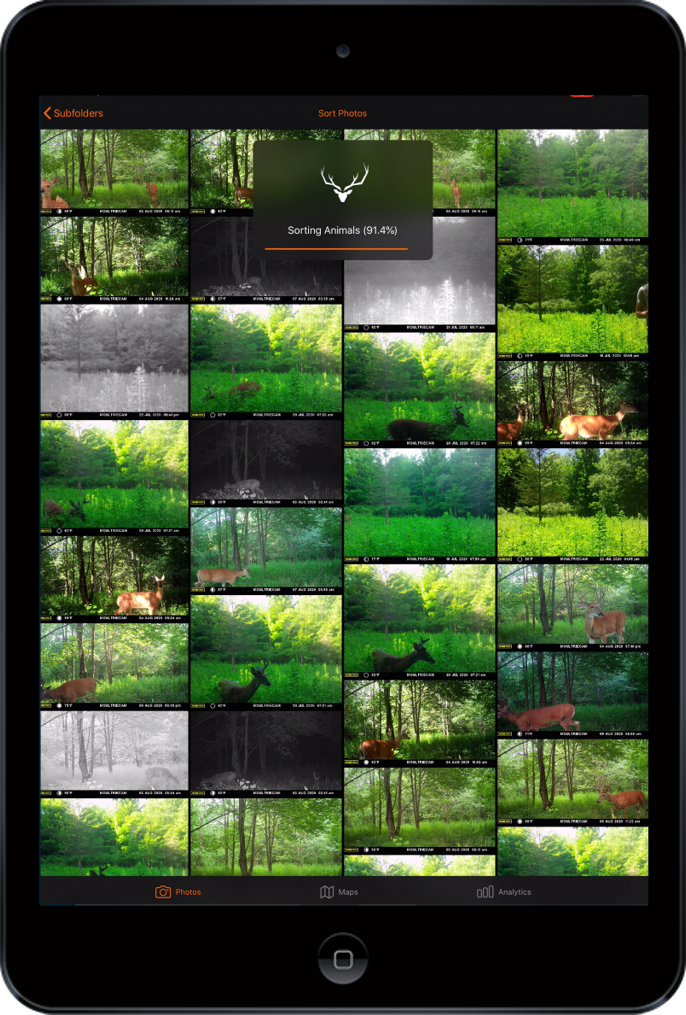
When using the “Classify” button, users are leveraging BuckSort®’s artificial intelligence capabilities. A convenient progress bar will show the status of the automated sorting process. The speed at which the sorting will run is dependent on your device. In general, older devices will run slower and newer devices will run faster. If you are sorting many photos, it is good practice to ensure your device doesn’t go to sleep. If it does, it’s not a huge deal, but the app will only sort those photos it has completed identifying prior to the device going to sleep.
If you are sorting many photos at one time, you may want to modify the sleep parameter on your device.
When sorting is completed, you will see a series of sub-folders with photos. Depending on what has been identified in your photos, you will likely see a folder for Bucks, Does, and Other Animals, as well as a folder for Empty photos. Presently, these are the categories your photos will be sorted into – although additional categories may be added in the future.
6.) To enter a sub-folder and view the images, simply tap on the folder. When inside the folder, feel free to scroll through the photos and click on any of them to view in full screen.
7.) When viewing photos in full-screen mode, you will notice some additional buttons. Starting on the top left, a back button is available to allow you to back out of full-screen mode and view all the images in the sub-folder.
Moving to the top right you will notice two buttons, an information button and a share button.
The information button is something you will see throughout the BuckSort® app. Each information button provides detailed information about the content on your screen.
Moving over to the share button, you can tap this button to share your photo with Family and Friends.
On the bottom of the screen you will see a trashcan button. Tapping on this button allows you to delete the photo you are viewing.
Finally, on the bottom left and right-hand corners of the screen are Buck Aging and Naming buttons. These buttons will only be active when viewing photos within the buck sub-folder. The buttons will turn orange when they are active. Within all other sub-folders, the buttons will be grayed-out and inactive.
8.) To age a buck, simply tap the Age button and select from the list. When you do this, the age you specify will be tagged to the photo. Repeat this process for all your bucks and you will be able to filter by age group within your Maps and Analytics charts.
9.) To name a buck, simply tap the Name button and type-out a name. Moving forward, this name becomes part of a list under the specific camera, allowing you to quickly tag photos of the same buck, with the same name, across all the photos in your buck sub-folder. Naming bucks of interest will allow you to filter bucks based on name when viewing your analytics, which may help you better pattern a specific buck’s movement and behavior.
10.) When sorting photos into sub-folders using AI, you will get incorrect classifications. It is for this reason we allow you to easily correct these misidentifications. The classify button on the top of the screen can be tapped to display a drop-down list of available identifications. Selecting one of these options will recategorize the photo as the selected option and re-file the photo into the appropriate sub-folder. Additionally, the metadata record for that photo will also record the reclassification so that your hunting insight maps and analytics charts properly display your data according to the corrected identification.
11.) If you ever want to Edit or Delete a camera, this can be done by tapping on the camera and then clicking the “Edit Camera” button on the top right of the screen. Doing this will pop-up the camera form, where you can change all the fields associated with the camera. Additionally, you can delete the camera, along with all of its photos, altogether. One thing to keep in mind though before you start editing cameras, is that most of the time, you’ll actually want to create a new camera as opposed to editing an old camera. The reason for this is editing an old camera can throw off your analytics. Remember that the data displayed in your analytics maps and charts is partially sourced from your camera information, so if you, as an example, change the location of your camera, you will also change your analytics. Therefore, it might be best to think of the cameras you create in BuckSort® as camera locations as opposed to physical cameras.
In-App Subscriptions
1.) Within BuckSort®, the Maps tab and Analytics tab require an In-App Subscription.
There are three ways to subscribe to BuckSort®:
If you’ve already downloaded the app – launch the app and tap on the Maps or Analytics tabs. A subscription pop-up should automatically appear. If it doesn’t, simply tap on the “Subscriptions” button on the top left of the screen.
From there, select the “Hunt Club” tab if it’s available – if not, skip to step 2c.
2a.) Select the subscription tier you would like to purchase, complete the on-screen prompts, and proceed through checkout.
2b.) If you have already subscribed through bucksortpro.com or a reseller’s website, or you would like to subscribe via bucksortpro.com or through a reseller’s website, simply select the subscription tier you would like to purchase on the website and complete the purchase through the onscreen prompts.
From there, you will receive an email with instructions on how to activate your subscription with a Subscription ID that will also be included in the email. To activate your subscription, simply download the app – if you haven’t already – launch the app on your device, tap the “Subscriptions” button, then select the Hunt Club Tab – if available and it isn’t selected already, and then tap the “Restore Purchases” button where you will be prompted to enter your “Subscription ID.” Next, simply copy and paste your Subscription ID, which is included in the email sent to you when you subscribed on the website, into the on-screen prompt. Then click “Restore.”
2c.) If you would like to purchase the app through the App Store, launch the app, tap on the “Subscriptions” button, choose the subscription tier you would like to purchase, and enter your Apple ID password when prompted.
Maps Tab
1.) Tap on the Maps Tab at the bottom-center of the screen.
2.) After tapping on the Maps Tab, an informational button is located on the top right of the screen and provides a detailed description of both the Heat Map and Home Range Map. Sitting next to the informational button is a Sync Data button, which can be tapped in order to refresh the map displays with the latest data from imported photos.
The map itself functions like a typical satellite map – allowing you to pinch-zoom in and out or use the zoom buttons on the top left of the map display. Also provided on the map display are a scale – located on the bottom left – and a view options button – located on the top right. Tapping on the View Options button will auto-scroll you to the map filtering and time slider options, which allow you to manipulate the Heat Map and Home Range Map overlays. If you do not use the View Options button you can also scroll down normally using your finger – just be sure to be touching outside the map display on the left or right-hand side. If you touch inside the map display you will move the map as opposed to moving the page.
The Heat Map provides an overview of average animal movement based on a series of selected filters. Filtering options include: Time Span, Camera Name, Species, Buck Age, and Buck Name.
3.) To use the heat map, select your desired filters below the map. The first filter is the time range drop-down, which represents the span of time you want to analyze. As an example, selecting “Last 2 Weeks” will pull trail camera data from only the last two weeks.
4.) Next, the camera filter allows you to select which specific camera(s) you would like to display.
5.) Next, the species filter allows you to select the specific animals you would like the heat map to display. If you select buck as one of these filters, you will see two additional filters pop up for Buck Name and Buck Age. If you have been labeling your buck photos with names and/or ages, you will see those selections as filtering options. These options will allow you to see heat maps representing specific bucks, if desired.
6.) After selecting all your filters, make sure to tap the “Save Changes” button to reset the heat map to your current filters. If you choose not to save any filters, the heat map will simply default to showing all your cameras and photo data.
7.) In addition to the filters, there is also a time slider. The time slider is a powerful tool to use after you have saved your filters. The time slider allows you to manipulate your heat map and see an hourly average of animal movement. The time slider is on a 24-hour scale. Dragging the slider will change the heat map in real-time to represent the average concentration of animal movement at each camera during that hour.
8.) Beneath the filters there are three checkboxes allowing you to alter the view of your heat map. The heat map checkbox simply turns the heat map graphics ON and OFF. The Home Range Zones checkbox turns the Home Range Zones ON and OFF. If you turn the Home Range Zones ON, a map legend will pop up in the map identifying the Home Range Zone, Core Zone, and Hot Zone. These zones represent likely home areas of white-tailed Bucks. If you are viewing the Home Range Zones during the rut, check the Rutting Season checkbox, which will change your Home Range Zones to be more representative of the season. Finally, if you do not have any buck photos or you have not included bucks in your filter selections, the Home Range Zones will not appear as they are specific to white-tailed buck as opposed to other animals.
9.) Moving on from the Heat Map and Home Range Map, Weather Forecasting is also included under the Maps tab. To view BuckSort’s weather visualization tool, simply tap on the Weather switch under the Maps tab. This will launch a weather map. Once again, an informational button will be located on the top right explaining how to use the map. The weather map provides powerful weather forecast visualizations. To use the weather map, simply select the weather metric you would like visualized on the top right and then use the time slider on the bottom of the map to see the weather visualization for a specific time. You can also tap the play button to see how conditions will change over time, on an hourly basis. At the very bottom of the map is the scale which will provide numerical readings for the selected weather metric. Available weather metrics include: Wind, Wind Gusts, Wind Accumulation, Rain/Thunder, Rain Accumulation, New Snow, Precipitation Type, Temperature, Dew Point, Humidity, Clouds, High Clouds, Medium Clouds, Low Clouds, Fog, CAPE Index, and Barometric Pressure. As with the other maps, you can pinch-zoom in and out as well as use the zoom buttons on the top right of the weather map display. One thing to note is the weather visualization layers are limited beyond certain zoom levels. If you zoom beyond these zoom-levels, the weather layer will transition to a satellite image with the locations of your cameras marked.
Analytics Tab
1.) Tap on the Analytics Tab, which is located on the bottom right of your screen. This tab will include all of your charts visualizing animal movement based on a variety of variables, including: Time, Temperature, Barometric Pressure, Wind Speed, Precipitation, and Cloud Cover.
2.) When first entering the Analytics tab, you will be placed on the Movement Summary Page. As always, an information button is located on the top right of the screen explaining how to read and manipulate the Movement Summary. The Movement Summary provides an overview of the time and environmental factors affecting animal movement. These factors include: Temperature, Barometric Pressure, Wind Speed, Precipitation, and Cloud Cover. This summary page highlights the specific time and environmental metrics correlated with heightened animal movement, as captured by your trail camera, based on the species, time span, and other filtering options selected at the bottom of the page. When reading the Movement Summary, the top line chart provides an overview of the number of photos of specific animals, captured by your trail camera, based on time. Spikes across the 24-hour scale provide insight into the specific times marked by heightened movement based on your selected filters.
Scrolling down to your donut charts, you can view the environmental conditions most affecting animal movement based on your selected filters. Each donut chart provides the associated metric tied to heightened animal movement based on the number of photos captured of the filtered animal type. As an example, if the Cloud Cover donut chart reads 0%, this would mean the most photos captured, based on your filters, were captured when skies were clear or, said another way, when Cloud Cover was at 0%.
Scrolling down the Movement Summary Page further, you will find filtering options. These filtering options are the same across the Movement Summary as well as all the Charts.
3.) To use the filtering options within the Movement Summary, as well as across all the remaining charts, simply select your desired filters below the charts. The first filter is the time range drop-down, which represents the range of time you want to analyze. As an example, selecting “Last 2 Weeks” will pull trail camera data from only the last two weeks.
4.) Next, the camera filter allows you to select which specific camera(s) you would like to display.
5.) Next, the species filter allows you to select the specific animals you would like the chart to represent. If you select buck as one of these filters, you will see two additional filters pop up for Buck Name and Buck Age. If you have been labeling your buck photos with names and/or ages, you will see those selections as filtering options. These options will allow you to view charts representing specific bucks, if desired.
6.) After selecting all your filters, make sure to tap the “Save Changes” button to reset the charts to your current filters. If you choose not to save any filters, the charts will simply default to showing all your cameras and photo data.
7.) Swipe the Movement summary page to the left and you will be taken to the Time Chart. Otherwise, tap the carrot icon at the top of the page and select the chart you would like to view. The Time Chart provides an overview of animal movement throughout a 24-hour day. Several filtering options are provided below the summary chart, including: Time Span, Camera Name, Species, Buck Age, and Buck Name. To read the chart, the X-Axis represents time on an hourly basis and the Y-Axis represents the number of photos captured during a given hour based on the filtering options saved below the chart. As an example, if you selected and saved “Buck”, “Last 14 Days”, “Camera 1” as your filtering options, you would see a line chart summarizing which hours, over the last 14 days, had the most Buck movement across Camera 1. Filtering further by Buck Age or Buck Name may assist you in more accurately patterning your deer.
8.) Swipe the Time Chart to the left and you will be taken to the Temperature Chart. Otherwise, tap the carrot icon at the top of the page and select the chart you would like to view. The Temperature Chart provides an overview of animal movement based on temperature. Several filtering options are provided below the summary chart, including: Time Span, Camera Name, Species, Buck Age, and Buck Name. To read the chart, the X-Axis represents temperature in degrees Fahrenheit and the Y-Axis represents the number of photos captured at a given temperature based on the filtering options saved below the chart. As an example, if you selected and saved “Buck”, “Last 14 Days”, “Camera 1” as your filtering options, you would see a line chart summarizing which temperatures, over the last 14 days, had the most Buck movement across Camera 1. Filtering further by Buck Age or Buck Name may assist you in more accurately patterning your deer.
9.) Swipe the Temperature Chart to the left and you will be taken to the Barometric Pressure Chart. Otherwise, tap the carrot icon at the top of the page and select the chart you would like to view. The Barometric Pressure Chart provides an overview of animal movement based on barometric pressure. Several filtering options are provided below the summary chart, including: Time Span, Camera Name, Species, Buck Age, and Buck Name. To read the chart, the X-Axis represents pressure in Inches of Mercury (inHg) and the Y-Axis represents the number of photos captured at a given pressure based on the filtering options saved below the chart. As an example, if you selected and saved “Buck”, “Last 14 Days”, “Camera 1” as your filtering options, you would see a line chart summarizing which pressures, over the last 14 days, had the most Buck movement across Camera 1. Filtering further by Buck Age or Buck Name may assist you in more accurately patterning your deer.
10.) Swipe the Barometric Pressure Chart to the left and you will be taken to the Wind Speed Chart. Otherwise, tap the carrot icon at the top of the page and select the chart you would like to view. The Wind Speed Chart provides an overview of animal movement based on wind speed. Several filtering options are provided below the summary chart, including: Time Span, Camera Name, Species, Buck Age, and Buck Name. To read the chart, the X-Axis represents wind speed in Miles Per Hour and the Y-Axis represents the number of photos captured at a given wind speed based on the filtering options saved below the chart. As an example, if you selected and saved “Buck”, “Last 14 Days”, “Camera 1” as your filtering options, you would see a line chart summarizing which wind speeds, over the last 14 days, had the most Buck movement across Camera 1. Filtering further by Buck Age or Buck Name may assist you in more accurately patterning your deer.
11.) Swipe the Wind Speed Chart to the left and you will be taken to the Precipitation Chart. Otherwise, tap the carrot icon at the top of the page and select the chart you would like to view. The Precipitation Chart provides an overview of animal movement based on precipitation. Several filtering options are provided below the summary chart, including: Time Span, Camera Name, Species, Buck Age, and Buck Name. To read the chart, the X-Axis represents precipitation in inches and the Y-Axis represents the number of photos captured at a given precipitation-level based on the filtering options saved below the chart. As an example, if you selected and saved “Buck”, “Last 14 Days”, “Camera 1” as your filtering options, you would see a line chart summarizing the amount of precipitation, over the last 14 days, that had the most Buck movement across Camera 1. Filtering further by Buck Age or Buck Name may assist you in more accurately patterning your deer.
12.) Swipe the Precipitation Chart to the left and you will be taken to the Cloud Cover Chart. Otherwise, tap the carrot icon at the top of the page and select the chart you would like to view. The Cloud Cover Chart provides an overview of animal movement based on cloud cover. Several filtering options are provided below the summary chart, including: Time Span, Camera Name, Species, Buck Age, and Buck Name. To read the chart, the X-Axis represents cloud cover (%) and the Y-Axis represents the number of photos captured at a given cloud cover based on the filtering options saved below the chart. As an example, if you selected and saved “Buck”, “Last 14 Days”, “Camera 1” as your filtering options, you would see a line chart summarizing which cloud cover percentages, over the last 14 days, had the most Buck movement across Camera 1. Filtering further by Buck Age or Buck Name may assist you in more accurately patterning your deer.
Not necessarily, but we do recommend Original Equipment Manufacturer (OEM) SD Card Readers (e.g. Apple) – particularly if you are using an iOS device (iPhone or iPad). Photo importing is controlled by the device and not the BuckSort® app. While testing, whether we were importing into BuckSort® or the Photo Gallery on our test devices, we had mixed results with non-OEM SD Card Readers – particularly with iPhones or iPads. In some cases importing was slower and in other cases our iPads wouldn’t recognize the SD Card Reader, preventing us from importing any photos regardless of whether we were using BuckSort® or any other Photos app on our devices. To purchase an OEM SD Card Reader for an iPhone or iPad, feel free to check out Apple.com and search “SD Card Reader”.
If you are having any issues importing photos into BuckSort®, read the answer to the question above that discusses SD Card Readers. If you do not think the SD Card Reader is the problem, you can try the following:
1.) Place your photos into a Folder with the name “DCIM” (without the quotation marks). Your trail camera will likely automatically place your pictures into a DCIM folder because it is the standard format for both Android and iOS systems – but if not, you can create your own DCIM folder and place your photos within it.
2.) Give your photos 8-character file names. Once again, for those of you using images straight from trail cameras, the trail camera should name the files correctly so that they can be imported onto the device. However, if you are pulling the images from elsewhere (e.g. Computer or hard-drive) the images may have been renamed at some point which could be causing the importing issue. Try renaming the files with an 8-character name (e.g. IMG_0001) and reinsert the SD card to import.
Tap the “Add Camera” button on the top right of the screen to add a camera. After adding the camera, add photos to the camera by importing them from an SD card or from your Photo Library. To learn more, be sure to check out our comprehensive How To Video above.
There is an orange progress bar at the top of the sorting page that shows a live view of the sorting progress. Wait for the progress bar to reach 100% and you will be taken to a sub-folders page where all your photos are sorted into sub-folders based on the animals identified in each of the photos.
No. When you add new photos to a camera, they will be imported into an “Unlabeled” folder next to your other sub-folders (e.g. Buck, Doe, Other Animal, Empty). Go into the Unlabeled folder and then tap sort. From there, BuckSort® will sort only the photos within the Unlabeled Folder and file them in the appropriate sub-folders. When sorting is complete you will notice the Unlabeled folder is gone and all your sub-folders will have more images inside of them.
Yes. In order to view accurate hunting insights, make sure you set the date and time correctly on your trail camera. BuckSort® will use this information when building the hunting insights maps and charts. If the date and time are wrong, your analytics will reflect that. As an example, if a photo is captured at 4:30pm on 09/25/2020 but your camera reports that it was taken at 12:00am on 01/01/2020, your analytics will be off because BuckSort® will display analytics that reflect the photo being captured at midnight on January 1st, 2020.
We’re working on it…stay tuned!
The BuckSort® application works by analyzing photos from your trail camera’s SD card (Standard or Micro) after you import the photos onto your smartphone or tablet. For this reason, the BuckSort® application is compatible with most trail cameras so long as they provide basic metadata (e.g. Date/Timestamp of Photo Capture).
The BuckSort® app is currently supported on iOS and Android.
The BuckSort® App is currently available on both the App Store (iOS) and Google Playstore (Android).
Currently, all subscriptions are managed through the App Store or Google Playstore* (*Coming Fall 2020). To subscribe, simply tap on the Maps or Analytics tabs and you will be prompted to subscribe. Next, select the subscription (either Monthly or Annual) you would like to purchase and enter your credentials (e.g. Apple ID/Password). If you’ve watched the comprehensive Tutorial/How To Video, you may have noticed two additional ways of subscribing through the app and through the website using the “Hunt Club” feature. This feature is not yet live within the app or on the website, so please use the App Store subscription process for the time being.
Currently, the BuckSort® App can identify Whitetail Bucks, Whitetail Doe, Bear, People, and Turkey. Importantly, the app can also recognize images with no animals present, saving you the hassle of swiping through empty photos. Presently, the app sorts imagery into “Buck”, “Doe”, “Other Animal”, and “Empty” sub-folders. The AI sorting the photos isn’t perfect and will make misidentifications, but it is a good first-pass filter and we provide users with an easy process to reclassify the imagery (if needed) using the “Classify” button.
Yes. We are currently working to increase the number of supported animals.
The BuckSort® app will generally categorize a photo with multiple, different animals as the animal of the most prominence in the photo.
The AI powering BuckSort® is not perfect and it will make mistakes. Additionally, results may vary depending on your region, but in general, the automated classification within BuckSort® will serve as a good first-pass – sorting your photos into Animal sub-folders. As more photos are fed into the system for training, accuracy will improve. Additionally, BuckSort® provides a reclassification button that allows users to quickly switch the category identified by the AI and refile the photo in the correct sub-folder automatically.
The BuckSort® App is FREE to download and includes sorting by Bucks, Doe, Other Animal, and Empty. In addition, in-app subscriptions are available at a cost of $14.99/month or $99.99/year and provide advanced hunting insights via Heat Maps, Home Range Maps, Weather Forecasting Tools, and Analytics Charts.
Check out the affiliate information at the bottom of this web page to learn more.
Do you have a Business, Social Media Account, or Non-Profit targeted to hunters? The BuckSort® Team is currently gauging interest in an Affiliate Program. If interested, please fill out the form below and we will contact you with additional information.
8300 Airport Rd - STE 3 Middleton, WI 53562
(608) 824-1131
info@bucksortpro.com
Copyright © 2023. Rapid Imaging Technologies LLC. All Rights Reserved. Privacy Policy | Terms of Use